Plane of Array (POA) irradiance model
Types of PV array trackers
| array.type | description |
|---|---|
| fh | Fixed (f) horizontal (h) |
| fl | Fixed (f) tilted (l) |
| th | Single axis horizontal (h) tracking (t) |
| tv | Single axis vertical (v) tracking (t) |
| tl | Single axis tilted (l) tracking (t) |
| td | Dual (d) axis tracking (t) |


All steps at once
library(merra2ools)
library(merra2sample)
# if (rerun) library(merra2sample)
library(tidyverse)
library(cowplot)
# Example dataset
# merra <- merra2_sample(month = 1:12, add.coord = T)
# Note: month = 1:12 requires ~64Gb of RAM
# one month (such as month = 3 or month = 1) requires ~10Gb or RAM
merra <- merra2_sample(month = c(3, 6, 9, 12), add.coord = T)
merra
x <- fPOA(merra) # keep.all = T - keeps all interim variablesFigure code
fig.POA <- function(x, name,
legend.position = NULL,
timestamp.position = NULL, ...) {
plot_merra(x, name = name, limits = c(0, 1200),
# legend.position = c(0.88, 0.05),
legend.position = legend.position,
legend.name = ("W/\u33A1"),
timestamp.position = timestamp.position,
expand.x = c(0.002, 0.005), expand.y = c(0.002, 0.005)
)
}
fig.POA(x, "SWGDN")
fig.POA.grid <- function(x,
legend.position = c(0.81, 0.08),
timestamp.position = c(125, 85),
...) {
plot_grid(
# fig.POA(x, "SWGDN", ...),
fig.POA(x, "POA.fh", ...),
fig.POA(x, "POA.fl", timestamp.position = timestamp.position, ...),
fig.POA(x, "POA.th", ...),
fig.POA(x, "POA.tv", ...),
fig.POA(x, "POA.tl", ...),
fig.POA(x, "POA.td", legend.position = legend.position, ...),
# fig.dPS(x),
labels = c( #"GHI",
"POA.fh", "POA.fl",
"POA.th", "POA.tv",
"POA.tl", "POA.td"),
ncol = 2, nrow = 3, hjust = -0.1, vjust = 1.1, label_size = 12,
label_colour = "black")
}
fig.POA.grid(x)
ii <- rep(TRUE, nrow(x))
# ii <- lubridate::month(x$UTC) <= 1; summary(ii)
gif_merra(x[ii,], FUN = "fig.POA.grid", dirname = "images", fps = 5,
gif.width = 1.25 * 576,
gif.height = 1.25 * 360 * 1.21,
filename.prefix = "fig.POA.grid")Step-by-step
Solar position
x <- solar_position(merra, keep.all = T, integral_steps = 1)
# x <- solar_position(merra, verbose = 0, keep.all = T)
# x <- azimuth.convertion(x)Figure code
x$na <- 1L; x$na[!x$beam] <- NA # drop nights
summary(x$beam)
plot_merra(x, "beam", limits = c(0, 1), palette = "YlGnBu",
legend.name = "")
summary(x$declination)
fig.declination <- function(x, limits = c(-.5, .5),
legend.name = "angle\u00b0",
...) {
plot_merra(x, "declination", limits = limits,
# palette = "YlGnBu",
legend.name = legend.name, ...)
}
fig.declination(x)
summary(x$eq_time)
fig.eq_time <- function(x, limits = c(-15, 15), ...) {
plot_merra(x, "eq_time", limits = limits, palette = "PRGn",
legend.name = "Munutes", direction = -1, ...)
}
fig.eq_time(x)
summary(x$solar_time)
fig.solar_time <- function(x, limits = c(-12, 36),
palette = "Dark2", legend.name = "Hours",
...) {
plot_merra(x, "solar_time", limits = limits,
palette = palette, legend.name = legend.name, ...)
}
fig.solar_time(x)
summary(x$hour_angle)
summary(rad2deg(x$hour_angle))
fig.hour_angle <- function(x, limits = c(-360, 360), scale = 180/pi,
palette = "Set1", legend.name = "angle\u00b0",
direction = 1, ...) {
plot_merra(x, "hour_angle", limits = limits, scale = scale,
palette = palette, legend.name = legend.name, direction = direction, ...)
}
fig.hour_angle(x)
summary(x$zenith)
fig.zenith <- function(x, ...) {
plot_merra(x, "zenith", limits = c(0, 90),
direction = 1,
scale = x$na,
palette = "Blues",
legend.name = "angle\u00b0", ...)
}
fig.zenith(x)
summary(x$azimuth_N)
fig.azimuth <- function(x, ...) {
plot_merra(x, "azimuth_N",
# limits = c(0, 360),
limits = c(-180, 180),
legend.name = "angle\u00b0",
palette = "Set1",
# palette = "Blues",
scale = x$na, direction = -1, ...)
}
fig.azimuth(x)
fig.solar_postion <- function(x,
legend.position = c(0.80, 0.08),
timestamp.position = c(125, 85),
...) {
plot_grid(fig.declination(x, timestamp.position = NULL,
legend.position = legend.position, ...),
fig.eq_time(x, timestamp.position = timestamp.position,
legend.position = legend.position, ...),
fig.solar_time(x, timestamp.position = NULL,
legend.position = legend.position, ...),
fig.hour_angle(x, timestamp.position = NULL,
legend.position = legend.position, ...),
fig.zenith(x, timestamp.position = NULL,
legend.position = legend.position, ...),
fig.azimuth(x, legend.position = legend.position,
timestamp.position = NULL, ...),
# fig.dPS(x),
labels = c("declination", "eq_time", "solar_time",
"hour_angle", "zenith", "azimuth_N"),
ncol = 2, nrow = 3, hjust = -0.1, vjust = 1.1, label_size = 12,
label_colour = "black")
}
fig.solar_postion(x)
# ii <- lubridate::hour(x$UTC) <= 2; summary(ii)
gif_merra(x, FUN = "fig.solar_postion", dirname = "images", fps = 5,
gif.width = 1.25 * 576,
gif.height = 1.25 * 360 * 1.21,
filename.prefix = "fig.solar_postion_")
Solar position variables
Global Horizontal Irradiance decomposition
Figure code
x <- ghi_decomposition(x, keep.all = T)
summary(x$ext_irrad)
fig.ext_irrad <- function(x, ...) {
plot_merra(x, "ext_irrad", limits = c(1300, 1450), direction = 1,
palette = "Oranges", legend.name = "W/\u33A1", ...)
}
fig.ext_irrad(x)
summary(x$clearness_index)
fig.clearness_index <- function(x, ...) {
plot_merra(x, "clearness_index", limits = c(0, 1), direction = -1,
palette = "Blues", ...)
}
fig.clearness_index(x)
summary(x$diffuse_fraction)
fig.diffuse_fraction <- function(x, ...) {
plot_merra(x, "diffuse_fraction", limits = c(0, 1), palette = "Blues",
direction = 1, ...)
}
fig.diffuse_fraction(x)
summary(x$DNI)
fig.DNI <- function(x, ...) {
plot_merra(x, "DNI", legend.name = "W/\u33A1", limits = c(0, 1200), ...)
}
fig.DNI(x)
summary(x$DHI)
fig.DHI <- function(x, ...) {
plot_merra(x, "DHI", legend.name = "W/\u33A1", limits = c(0, 1200), ...)
}
fig.DHI(x)
fig.ghi_decomposition <- function(x,
legend.position = c(0.81, 0.09),
timestamp.position = c(125, 85),
...) {
plot_grid(fig.POA(x, "SWGDN", timestamp.position = NULL,
legend.position = NULL,
limits = c(0, 1200), ...),
fig.ext_irrad(x, timestamp.position = timestamp.position,
legend.position = legend.position, ...),
fig.clearness_index(
x, timestamp.position = NULL,
legend.position = NULL, ...),
fig.diffuse_fraction(x, timestamp.position = NULL,
legend.position = legend.position, ...),
fig.DNI(x, timestamp.position = NULL,
legend.position = NULL, ...),
fig.DHI(x, timestamp.position = NULL,
legend.position = legend.position, ...),
# fig.azimuth(x, legend.position = legend.position,
# timestamp.position = NULL, ...),
# # fig.dPS(x),
labels = c("GHI", "ext_irrad", "clearness_index",
"diffuse_fraction", "DNI", "DHI"),
ncol = 2, nrow = 3, hjust = -0.1, vjust = 1.1, label_size = 12,
label_colour = "black")
}
fig.ghi_decomposition(x)
gif_merra(x, FUN = "fig.ghi_decomposition", dirname = "images", fps = 5,
gif.width = 1.25 * 576,
gif.height = 1.25 * 360 * 1.21,
filename.prefix = "fig.ghi_decomposition_")
Global Horizontal Irradiance decomposition
PV-array position
Figure code
x <- pv_array_position(x, array.type = "all")
x
# convert azimuth from "Q" to "N" for figures
x <- merra2ools:::azimuth_Q2N(x,
paste0("array.azimuth_Q.", pv_array_types()[,1]),
paste0("array.azimuth_N.", pv_array_types()[,1]))
fig.array.tilt <- function(x, array.type = "fl", ...) {
plot_merra(x, paste0("array.tilt.", array.type), limits = c(0, 90),
palette = "Spectral", direction = -1, ...)
}
fig.array.azimuth <- function(x, array.type = "fl", azimuth.suffix = "_N",
limits = c(0, 360), ...) {
plot_merra(x, paste0("array.azimuth", azimuth.suffix, ".", array.type),
limits = limits, # c(0, 360)
# limits = c(-180, 180),
direction = -1, palette = "Set1", ...)
}
summary(x$array.tilt.fh); summary(x$array.azimuth.fh)
fig.array.tilt(x, "fh")
fig.array.azimuth(x, "fh")
fig.array.azimuth(x, "fh", azimuth.suffix = "_Q")
summary(x$array.tilt.fl); summary(x$array.azimuth.fl)
fig.array.tilt(x, "fl")
fig.array.azimuth(x, "fl")
summary(x$array.tilt.th); summary(x$array.azimuth.th)
fig.array.tilt(x, "th")
fig.array.azimuth(x, "th", scale = x$na)
summary(x$array.tilt.tl); summary(x$array.azimuth.tl)
fig.array.tilt(x, "tl")
fig.array.azimuth(x, "tl", scale = x$na)
summary(x$array.tilt.tv); summary(x$array.azimuth.tv)
fig.array.tilt(x, "tv")
fig.array.azimuth(x, "tv", scale = x$na)
summary(x$array.tilt.td); summary(x$array.azimuth.td)
fig.array.tilt(x, "td")
fig.array.azimuth(x, "td", scale = x$na)
fig.array.azimuth(x, "td", azimuth.suffix = "")
fig.array.tilt.grid <- function(
x, legend.position = c(0.81, 0.08),
timestamp.position = c(125, 85), ...) {
plot_grid(
fig.array.tilt(x, "fh", timestamp.position = NULL, legend.position = NULL,
scale = x$na, ...),
fig.array.tilt(x, "fl", timestamp.position = timestamp.position,
legend.position = NULL, scale = x$na, ...),
fig.array.tilt(x, "th", scale = x$na,
timestamp.position = NULL, legend.position = NULL, ...),
fig.array.tilt(x, "tv", scale = x$na,
timestamp.position = NULL, legend.position = NULL, ...),
fig.array.tilt(x, "tl", scale = x$na,
timestamp.position = NULL, legend.position = NULL, ...),
fig.array.tilt(x, "td", scale = x$na,
timestamp.position = NULL,
legend.position = legend.position, ...),
labels = c("fh", "fl", "th", "tv", "tl","td"),
ncol = 2, hjust = -0.1, vjust = 1.1, label_size = 12,
label_colour = "#fdf8db")
}
ii <- x$hour == 12
b <- fig.array.tilt.grid(x[ii,], legend.position = c(0.81, 0.12))
ggsave("images/fig.array.tilt.grid.png", b, width = 7, height = 10.5/2)
gif_merra(x, FUN = "fig.array.tilt.grid",
dirname = "images", fps = 5,
gif.width = 1.25 * 576,
gif.height = round(1.25 * 360 * 1.21),
filename.prefix = "fig.array.tilt.grid_")
fig.array.azimuth.grid <- function(
x, legend.position = c(0.81, 0.08),
timestamp.position = c(125, 85), ...) {
plot_grid(
fig.array.azimuth(x, "fh",
timestamp.position = NULL, legend.position = NULL,
scale = x$na, ...),
fig.array.azimuth(x, "fl", timestamp.position = timestamp.position,
legend.position = NULL,
scale = x$na, ...),
fig.array.azimuth(x, "th", scale = x$na,
timestamp.position = NULL, legend.position = NULL, ...),
fig.array.azimuth(x, "tv", scale = x$na,
timestamp.position = NULL, legend.position = NULL, ...),
fig.array.azimuth(x, "tl", scale = x$na,
timestamp.position = NULL, legend.position = NULL, ...),
fig.array.azimuth(x, "td", scale = x$na, timestamp.position = NULL,
legend.position = legend.position, ...),
labels = c("fh", "fl", "th", "tv", "tl","td"),
ncol = 2, hjust = -0.1, vjust = 1.1, label_size = 12,
label_colour = "#fdf8db")
}
ii <- x$hour == 12
b <- fig.array.azimuth.grid(x[ii,], legend.position = c(0.81, 0.12))
ggsave("images/fig.array.azimuth.grid.png", b,
width = 7, height = 10.5/2)
gif_merra(x, FUN = "fig.array.azimuth.grid",
dirname = "images", fps = 5,
gif.width = 1.25 * 576,
gif.height = round(1.25 * 360 * 1.21),
filename.prefix = "fig.array.azimuth_N.grid_")
gif_merra(x, FUN = "fig.array.azimuth.grid",
azimuth.suffix = "_Q", limits = c(-180, 180),
dirname = "images", fps = 5,
gif.width = 1.25 * 576,
gif.height = round(1.25 * 360 * 1.21),
filename.prefix = "fig.array.azimuth_Q.grid_")
PV-array tilt for alternative tracking
systems
PV-array azimuth_N (facing North) by tracking
systems
Angle of Incidence (AOI)
Figure code
x <- angle_of_incidence(x, array.type = "all")
fig.AOI <- function(x, array.type = "fl", ...) {
plot_merra(x, paste0("AOI.", array.type), limits = c(0, 90),
direction = 1,
# palette = "Blues",
palette = "Set1",
legend.name = "angle\u00b0",
scale = 180/pi, ...)
}
summary(x$AOI.fh); summary(rad2deg(x$AOI.fh))
fig.AOI(x, "fh")
summary(rad2deg(x$AOI.fl))
fig.AOI(x, "fl")
summary(rad2deg(x$AOI.th))
fig.AOI(x, "th")
summary(rad2deg(x$AOI.tl))
fig.AOI(x, "tl")
summary(rad2deg(x$AOI.tv))
fig.AOI(x, "tv")
summary(rad2deg(x$AOI.td))
fig.AOI(x, "td")
fig.AOI.grid <- function(x,
legend.position = c(0.81, 0.08),
timestamp.position = c(125, 85),
...) {
plot_grid(
fig.AOI(x, "fh", timestamp.position = NULL,
legend.position = NULL, ...),
fig.AOI(x, "fl", timestamp.position = timestamp.position,
legend.position = NULL, ...),
fig.AOI(x, "th", timestamp.position = NULL,
legend.position = NULL, ...),
fig.AOI(x, "tv", timestamp.position = NULL,
legend.position = NULL, ...),
fig.AOI(x, "tl", timestamp.position = NULL,
legend.position = NULL, ...),
fig.AOI(x, "td", legend.position = legend.position,
timestamp.position = NULL, ...),
# fig.dPS(x),
labels = c("AOI - fh", "AOI - fl",
"AOI - th", "AOI - tv",
"AOI - tl", "AOI - td"),
ncol = 2, nrow = 3, hjust = -0.1, vjust = 1.1, label_size = 12,
label_colour = "#fdf8db")
}
ii <- x$hour == 12
a <- fig.AOI.grid(x[ii,], legend.position = c(0.78, .12))
ggsave("images/fig.AOI.grid_int2.png", a, width = 8, height = 6)
gif_merra(x, FUN = "fig.AOI.grid", dirname = "images", fps = 5,
gif.width = 1.25 * 576,
gif.height = round(1.25 * 360 * 1.21),
filename.prefix = "fig.AOI.grid_")
PV-array position for alternative tracking
systems
Plane of Array (POA) irradiance
x <- poa_irradiance(x, array.type = "all", keep.all = T)
fig.POA.grid(x)
# ggsave("images/poa_by_type.png", width = 7, height = 8.)Validation: comparison with NREL’s PVWAtts model estimates
code
Fetching POA estimates from NREL’s PVWatts
st_id <- merra2ools::pvwatts_stations_sample
# Fetching the data from PVWAtts in select locations
if (!file.exists("tmp/pvwatts_poa_db.RData")) {
ll <- list()
for (tp in c("fh", "fl", "th", "tv", "tl", "td")) {
for (i in 1:nrow(st_id)) {
x <- fetch_pvwatts(
array.type = tp,
lon = st_id$lon_stn[i],
lat = st_id$lat_stn[i],
# tilt = abs(st_id$lat[i]),
# tilt = 0,
azimuth = ifelse(st_id$lat_stn[i] < 0, 0, 180),
radius = 100
)
cat("type = ", tp, ", i = ", i, ", lon = ",
st_id$lon_stn[i], ", lat = ", st_id$lat_stn[i],
", poa: ", length(x$outputs$poa), "\n", sep = "")
nm <- paste(tp, i, sep = "_")
ll[[nm]] <- x
if (!is.null(x$error$code)) {
if (x$error$code == "OVER_RATE_LIMIT") break
}
}
if (!is.null(x$error$code)) {
if (x$error$code == "OVER_RATE_LIMIT") break
}
}
names(ll)
save(ll, st_id, file = "tmp/pvwatts_poa_full_list.RData") #'raw' data
# Merging hourly POA (PVWatts) ####
yday_hour <- expand.grid(hour = 1:24, yday = 1:365) %>% as_tibble()
for (i in 1:length(ll)) {
n <- names(ll)[i]
cat(n); cat(" ")
x <- sapply(ll[[i]]$outputs, unlist)
x <- try(
as_tibble(x[5:15]) %>%
mutate(
# request = i,
lon_stn = ll[[i]]$station_info$lon,
lat_stn = ll[[i]]$station_info$lat,
lonlat = paste0("(", round(lon_stn, 2), ", ", round(lat_stn, 2), ")"),
elev = ll[[i]]$station_info$elev,
tz = ll[[i]]$station_info$tz,
month = yday2month(yday_hour$yday),
yday = as.integer(yday_hour$yday),
hour = as.integer(yday_hour$hour) - 1,
# lon_inp = as.numeric(ll[[i]]$inputs$lat),
# lat_inp = as.numeric(ll[[i]]$inputs$lon),
# module_type = as.integer(ll[[i]]$inputs$module_type),
# losses = as.numeric(ll[[i]]$inputs$losses),
# id = as.integer(gsub("[a-z_]", "", i)),
array.type = substr(n, 1, 2),
# array_type_pvwatts = ll[[i]]$inputs$array_type,
tilt = as.numeric(ll[[i]]$inputs$tilt),
azimuth = as.numeric(ll[[i]]$inputs$azimuth),
.before = ac_annual), silent = T
)
if (i == 1 || !exists("db") || is.null(db)) {
db <- NULL
if (all(class(x) != "try-error")) db <- x
} else {
if (all(class(x) != "try-error")) db <- bind_rows(db, x)
}
}
db
db %>% as.data.table()
dim(db)
db <- right_join(select(st_id, locid, lonlat), db)
save(db, file = "tmp/pvwatts_poa_db.RData")
} else {
# loading pre-saved data
(load("tmp/pvwatts_poa_db.RData"))
}
db$array.type[db$array.type == "tv"] <- "tl"
# summarizing the data for comparison
db_m <- db %>%
group_by(lonlat, locid, month, hour, array.type) %>%
summarise(poa = max(poa, na.rm = T)) %>%
mutate(month = factor(month.abb[month], levels = month.abb, ordered = T),
data = factor("PVWatts", levels = c("merra2ools", "PVWatts"), ordered = T)) %>%
ungroup()POA figures
# Plot POA for select (random) locations ####
set.seed(0)
ii <- db_m$lonlat %in% sample(unique(db_m$lonlat), 4) &
db_m$month %in% c("Mar", "Jul", "Oct", "Dec"); summary(ii)
ggplot(db_m[ii,]) +
geom_line(aes(hour, poa, colour = array.type, linetype = array.type), size = 1) +
scale_color_brewer(palette = "Set1", name = "Array type") +
guides(colour = guide_legend(override.aes = list(linetype = 1:5))) +
scale_linetype(guide = FALSE) +
facet_grid(lonlat ~ month) +
labs(y = "POA irradiance, Watt/m2", x = "Hour, local time") +
theme_bw()
ggplot(db_m[ii,]) +
geom_line(aes(hour, poa, colour = month), size = 1) +
scale_color_brewer(palette = "Set1", name = "Month") +
facet_grid(lonlat ~ array.type) +
labs(y = "POA irradiance, Watt/m2", x = "Hour, local time") +
theme_bw()Getting MERRA-2 data for the same locations
merra0 <- get_merra2_subset(locid = st_id$locid,
from = "2009-01-01 00",
to = "2011-12-31 23")
merra0Estimating POA on MERRA-2 data
x <- merra0 %>% fPOA(keep.all = T)
x <- mutate(x,
month = month(UTC),
month = factor(month.abb[month], levels = month.abb, ordered = T)) %>%
group_by(locid, month, hour) %>%
summarise(
POA.fh = max(POA.fh, na.rm = T),
POA.fl = max(POA.fl, na.rm = T),
POA.th = max(POA.th, na.rm = T),
POA.tl = max(POA.tl, na.rm = T),
POA.tv = max(POA.tv, na.rm = T),
POA.td = max(POA.td, na.rm = T)
# SWGDN = max(SWGDN, na.rm = T)
) %>%
ungroup() %>% #select(-lon, -lat) %>%
left_join(select(st_id, locid, tz_stn)) %>%
mutate(hour = hour_utc2tz(hour, tz_offset = tz_stn)) %>%
select(-tz_stn) %>%
mutate(data = factor("merra2ools", levels = c("merra2ools", "PVWatts"), ordered = T)) %>%
pivot_longer(cols = starts_with("POA."), names_to = "array.type", values_to = "poa") %>%
mutate(array.type = sub("POA.", "", array.type))
x
db_m[,-1]
if (F) { # interim check - POA figure based on MERRA-2
jj <- x$locid == sample(x$locid, 1)
xx <- left_join(x[jj,], select(st_id, locid, lonlat))
ggplot(xx) +
geom_line(aes(hour, poa, colour = array.type), size = 1) +
# facet_grid(month~id) +
facet_wrap(~month) +
theme_bw() +
labs(title = paste0("PVWatts station coord ",
unique(xx$lonlat),
", MERRA-2 locid = ", unique(xx$locid)))
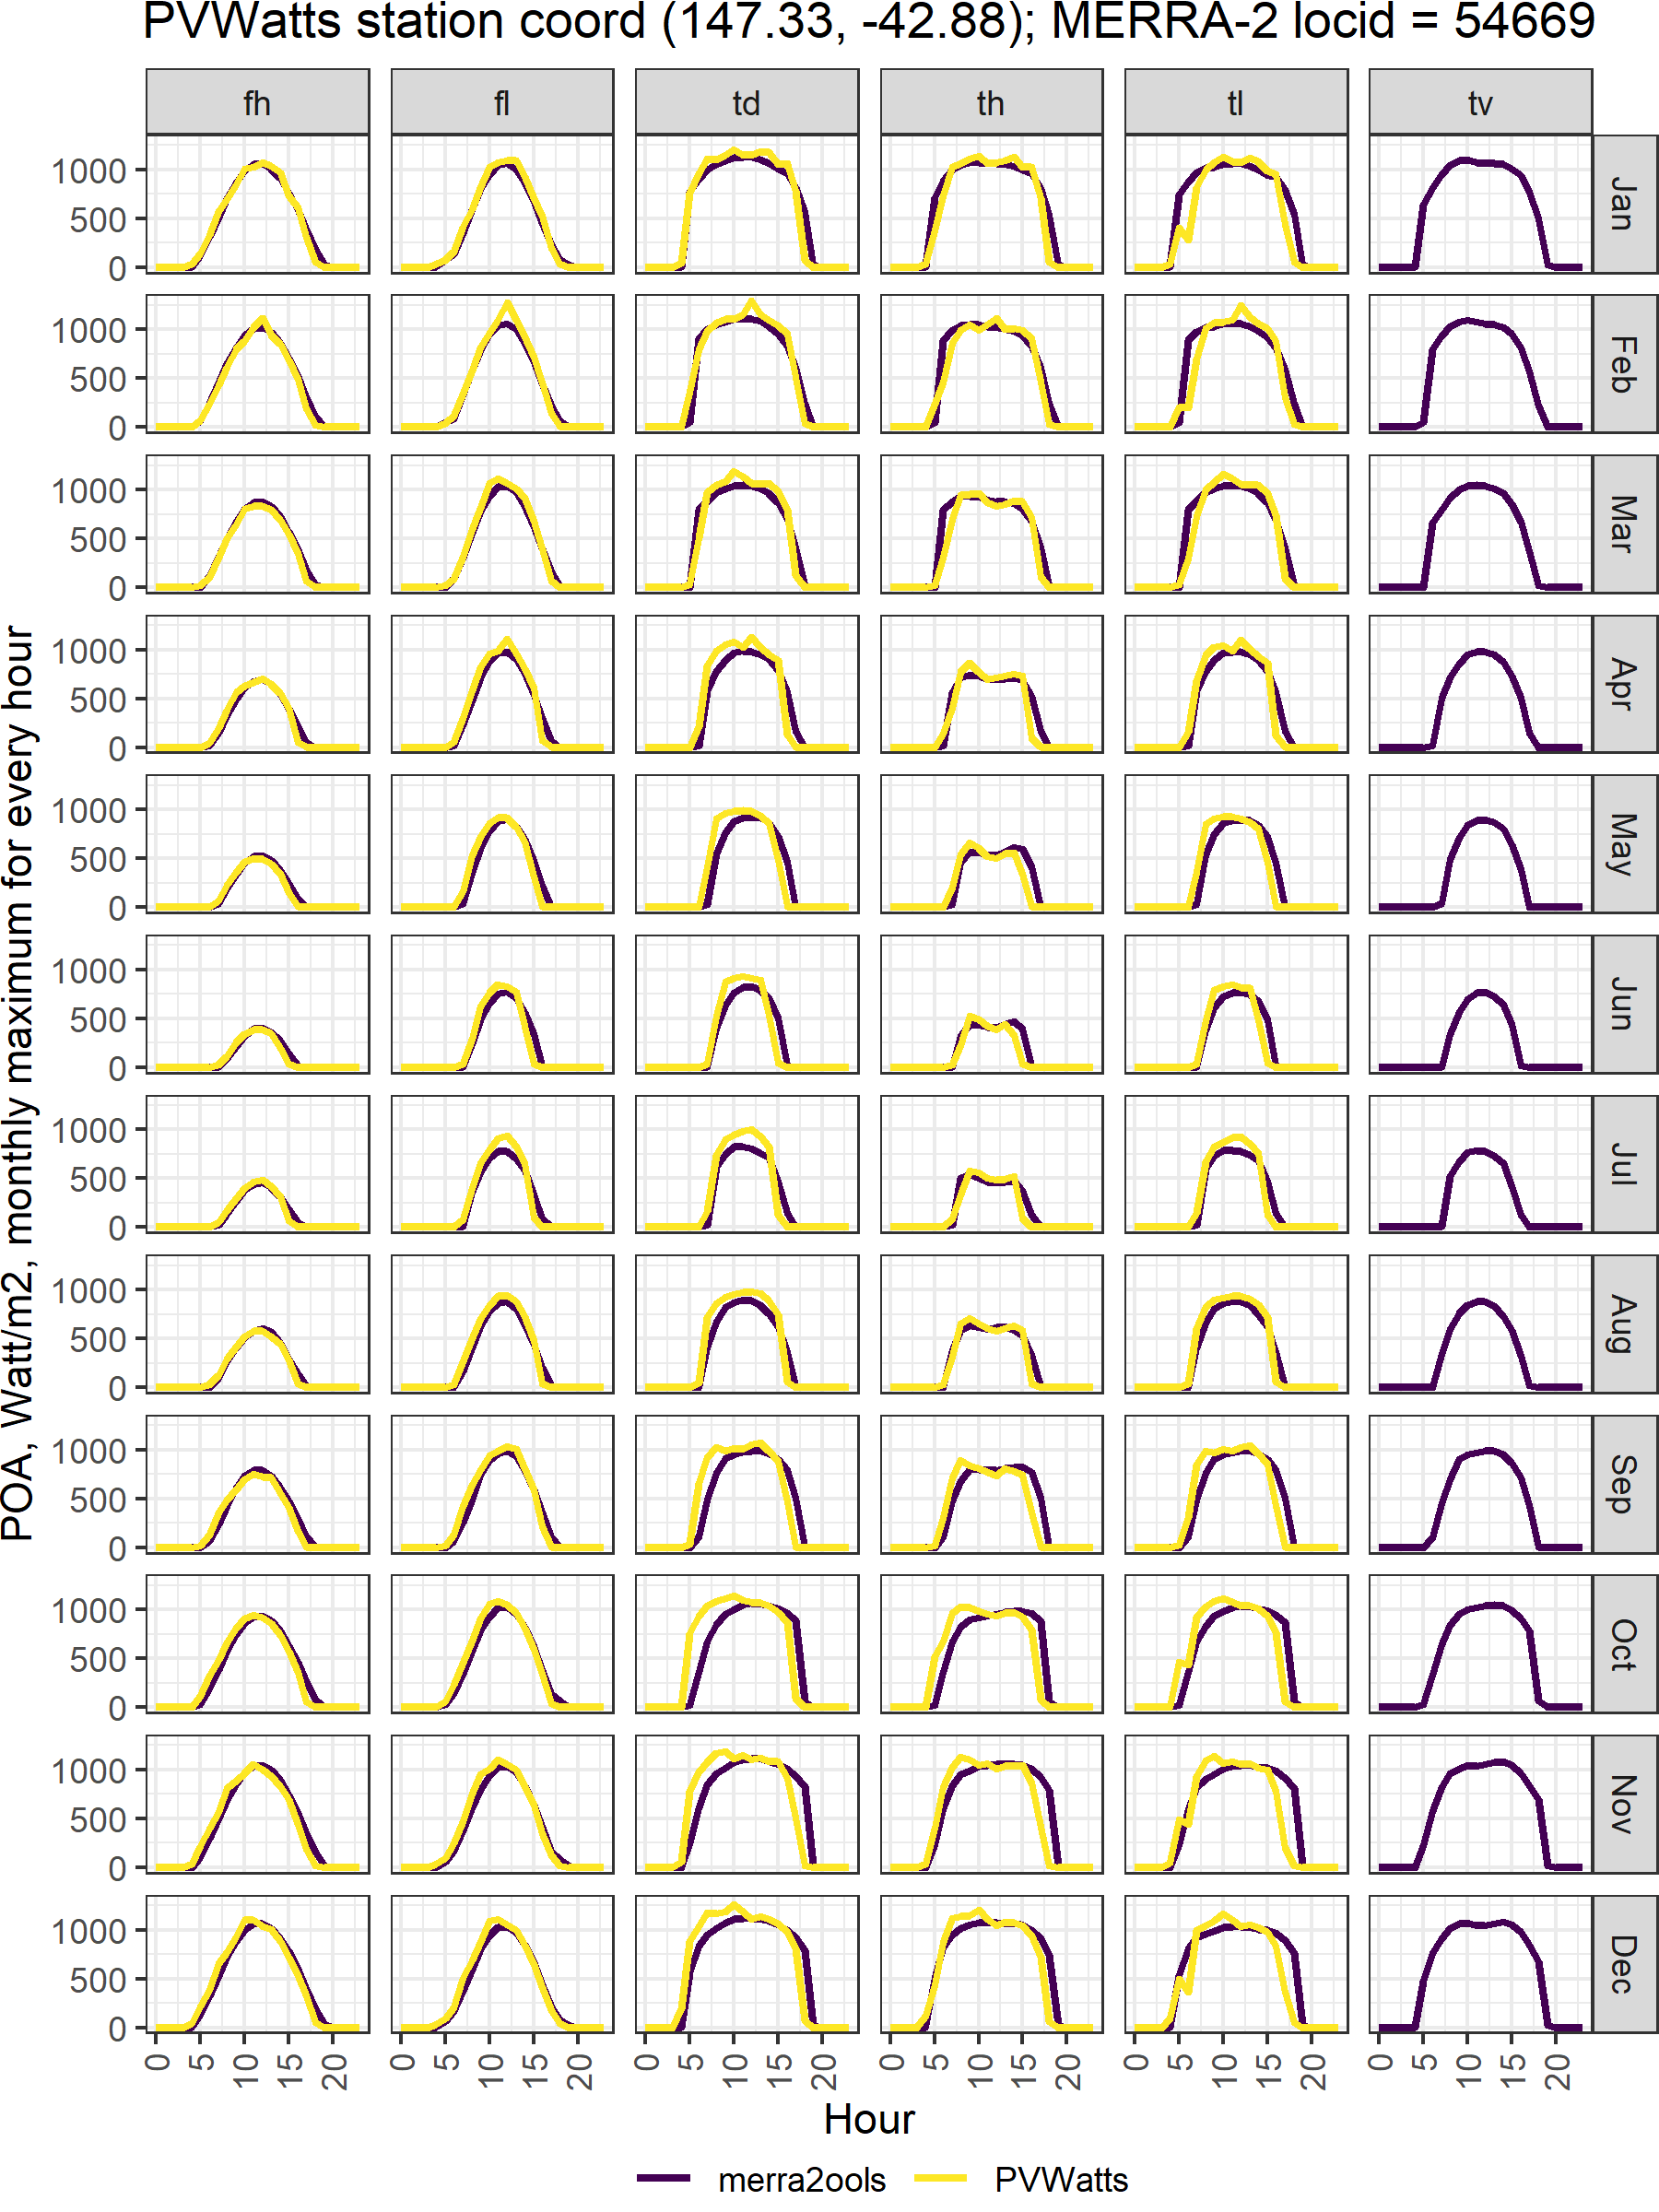
}Compare PVWatts and MERRA-2 estimates
y <- bind_rows(
select(db_m, data, locid, month, hour, array.type, poa),
select(x, data, locid, month, hour, array.type, poa)) %>%
left_join(st_id[, c("locid", "lonlat")]) %>%
add_coord() %>% ungroup() %>%
mutate(locid_lonlat = paste0(locid, " (", lon, ", ", lat, ")")) %>%
as.data.table() %>%
select(-lon, -lat)
fig.PVWatts_MERRA <- function(x, lid = NULL) {
lids <- unique(x$locid)
if (length(lids) > 1) {
if (is.null(lid)) {lid <- sample(lids, 1)}
}
if (!is.null(lid)) {
ii <- x$locid %in% lid
} else {
ii <- rep(TRUE, nrow(x))
}
ggplot(x[ii,]) +
geom_line(aes(hour, poa, colour = data), size = 1) +
facet_grid(month ~ array.type) +
theme_bw() +
scale_color_viridis_d(name = "") +
theme(
legend.position = "bottom",
legend.margin = margin(0,0,0,0),
legend.box.margin = margin(-10,0,0,0),
plot.margin = unit(c(0,0,0,0), "mm"),
plot.title = element_text(hjust = 0.5),
axis.text.x = element_text(angle = 90, vjust = 0.5, hjust=1)) +
guides(colour = guide_legend(nrow = 1)) +
labs(title = paste0("PVWatts station coord ", unique(x[ii,]$lonlat),
"; MERRA-2 locid = ", unique(x[ii,]$locid)),
x = "Hour", y = "POA, Watt/m2, monthly maximum for every hour")
}
fig.PVWatts_MERRA(y)
lids <- unique(y$locid) %>% sort()
fld <- "images/poa_pvwatts_merra"
if (!dir.exists(fld)) dir.create(fld, recursive = T)
for (i in lids) {
if (i == lids[1]) cat("locid: ")
cat(i, "")
gg <- fig.PVWatts_MERRA(y, i)
fname <- paste0("poa_pvwatts_vs_merra2_locid_", formatC(i, width = 6, flag = "0"), ".png")
ggsave(file.path(fld, fname), gg, width = 6, height = 8, units = "in")
}