library(merra2ools)
library(tidyverse)
# data_month <- 1
data_month <- 1:12
# get example of the data for all locations
x <- merra2_sample(data_month, add.coord = T)
x
Included variables
MERRA-2 variables in merra2ools database
Temperature at 10 meters hight (T10M), Kelvin degrees
Figure code
summary(x$T10M)
summary(x$T10M - 272) # Kelvin -> Celsius

plot_merra(x, name = "T10M",
           scale = 1, intercept = -272, # Kelvin -> Celsius
           limits = c(-50, 50),
           legend.name = "\u00B0C",
           datetime.position = c(144, 87))

gif_merra(x, name = "T10M", dirname = "images", fps = 10,
          limits = c(-50, 50), intercept = -272,
          legend.position = c(0.9, 0.05),
          legend.name = expression("\u00B0C"),
          datetime.position = c(144, 87))
Temperature at 10 meters hight, Celsius
Wind speed at 10 and 50 meters hights (W10M and W50M), m/s
Figure code
summary(x$W50M)
# fig.W50M <-
plot_merra(x, name = "W50M", limits = c(0, 30),
           legend.name = expression("m/s"),
           datetime.position = c(144, 87))

# fig.W10M <-
plot_merra(x, name = "W10M", limits = c(0, 30),
           legend.name = expression("m/s"),
           datetime.position = c(144, 87))

gif_merra(x, name = "W50M", dirname = "images", fps = 12,
          limits = c(0, 30),
          legend.position = c(0.9, 0.05),
          legend.name = expression("m/s"),
          datetime.position = c(144, 87))


gif_merra(x, name = "W10M", dirname = "images", fps = 12,
          limits = c(0, 30),
          legend.position = c(0.9, 0.05),
          legend.name = expression("m/s"),
          datetime.position = c(144, 87))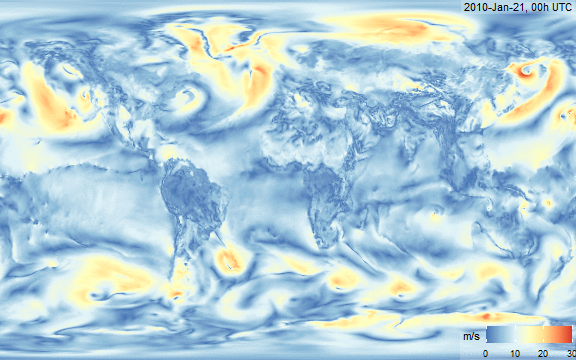
Wind speed at 50 meters hight
Global Horizontal Irradiance (SWGDN), Watt/m2
Figure code
summary(x$SWGDN)

plot_merra(x, name = "SWGDN", limits = c(0, 1200),
           legend.position = c(0.88, 0.05),
           legend.name = ("W/\u33A1"),
           datetime.position = c(144, 87))

plot_merra(x, name = "SWGDN", dirname = "images", fps = 5,
          limits = c(0, 1), scale = 1/1000,
          legend.position = c(0.88, 0.05),
          legend.name = ("kW/\u33A1"),
          datetime.position = c(144, 87))

gif_merra(x, name = "SWGDN", dirname = "images", fps = 5,
          limits = c(0, 1200), scale = 1,
          legend.position = c(0.88, 0.05),
          legend.name = ("W/\u33A1"),
          datetime.position = c(144, 87))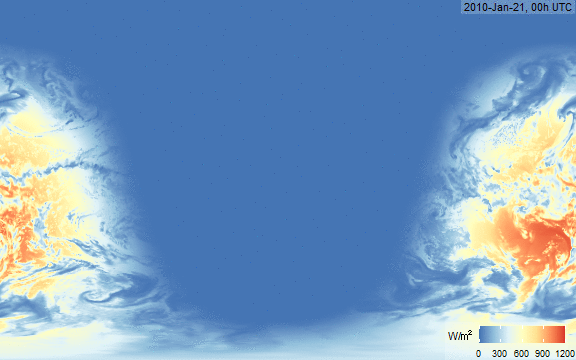
Global Horizontal Irradiance
Albedo (ALBEDO), index [0..1]
Figure code
summary(x$ALBEDO)

plot_merra(x, name = "ALBEDO", dirname = "images", fps = 5,
          limits = c(0, 1), scale = 1,
          legend.position = c(0.9, 0.05),
          legend.name = (""),
          datetime.position = c(144, 87))

gif_merra(x, name = "ALBEDO", dirname = "images", fps = 5,
          limits = c(0, 1), scale = 1,
          legend.position = c(0.9, 0.05),
          legend.name = (""),
          datetime.position = c(144, 87))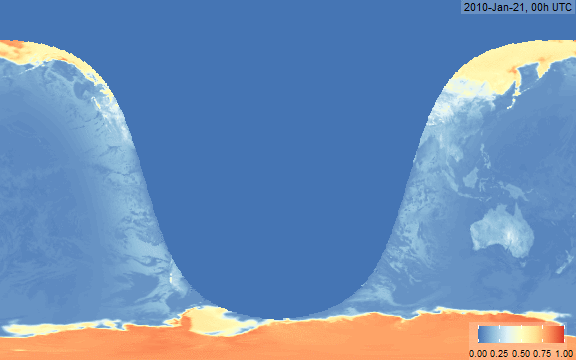
Surface albedo
Surface atmospheric preassure (PS), hPa
Figure code
summary(x$PS_hPa)

plot_merra(x, name = "PS_hPa", dirname = "images", fps = 5,
          limits = c(500, 1000), scale = 1, direction = 1,
          legend.position = c(0.89, 0.05), palette = "YlGnBu",
          legend.name = ("hPa"),
          datetime.position = c(144, 87))

gif_merra(x, name = "PS_hPa", dirname = "images", fps = 24,
          limits = c(500, 1000), scale = 1, direction = 1,
          legend.position = c(0.89, 0.05),
          legend.name = ("hPa"),
          datetime.position = c(144, 87))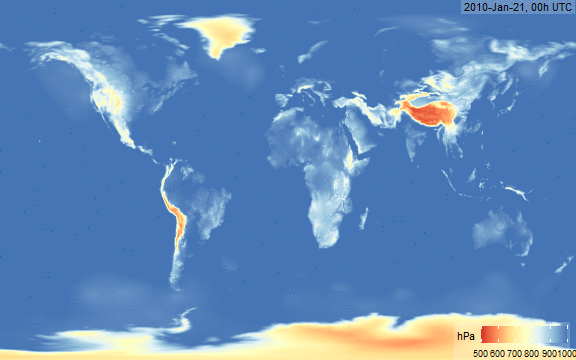
Surface pressure
Figure code
PS_mean <- x %>%
  group_by(locid) %>%
  summarise(PS_mean = mean(PS_hPa, na.rm = TRUE), .groups = "drop")

x <- full_join(x, PS_mean) %>%
  mutate(dPS = PS_hPa - PS_mean)
summary(x$dPS)

plot_merra(x, name = "dPS", dirname = "images", fps = 5,
          limits = c(-30, 30), scale = 1, direction = -1,
          legend.position = c(0.9, 0.05),
          legend.name = ("hPa"),
          datetime.position = c(144, 87))

gif_merra(x, name = "dPS", dirname = "images", fps = 5,
          limits = c(-30, 30), scale = 1, direction = -1,
          legend.position = c(0.89, 0.05),
          legend.name = ("hPa"),
          datetime.position = c(144, 87))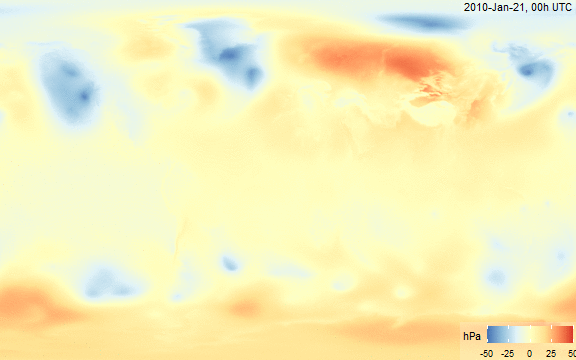
Surface pressure difference from mean value
Combined figures code
fig.T10M <- function(x) {
  plot_merra(x, name = "T10M", intercept = -272,
             limits = c(-50, 50), legend.name = "\u00B0C",
           # datetime.position = c(144, 87),
           # legend.position = c(0.89, 0.05),
           legend.position = NULL,
           datetime.position = NA,
           expand.x = c(0.002, 0.005), expand.y = c(0.002, 0.005))
}
# fig.T10M(x)

fig.W50M <- function(x) {
    plot_merra(x, name = "W50M", limits = c(0, 30),
           legend.name = expression("m/s"),
           datetime.position = c(110, 87),
           # legend.position = c(0.89, 0.05),
           legend.position = NULL,
           # datetime.position = NA,
           expand.x = c(0.002, 0.005), expand.y = c(0.002, 0.005)
           )
}
# fig.W50M(x)

fig.W10M <- function(x) {
    plot_merra(x, name = "W10M", limits = c(0, 30),
           legend.name = expression("m/s"),
           # datetime.position = c(144, 87)
           # legend.position = c(0.89, 0.05),
           legend.position = NULL,
           datetime.position = NA,
           expand.x = c(0.002, 0.005), expand.y = c(0.002, 0.005)
           )
}
# fig.W10M(x)

fig.ALBEDO <- function(x) {
  plot_merra(x, name = "ALBEDO", dirname = "images", fps = 5,
          limits = c(0, 1), scale = 1,
          # legend.position = c(0.9, 0.05),
          legend.position = NULL,
          legend.name = (""),
           datetime.position = NA,
           expand.x = c(0.002, 0.005), expand.y = c(0.002, 0.005)
           )
}
# fig.ALBEDO(x)

fig.SWGDN <- function(x) {
  plot_merra(x, name = "SWGDN", limits = c(0, 1200),
           # legend.position = c(0.88, 0.05),
           legend.position = NULL,
           legend.name = ("W/\u33A1"),
           datetime.position = NULL,
           expand.x = c(0.002, 0.005), expand.y = c(0.002, 0.005)
           )
}
# fig.SWGDN(x)

fig.PS_hPa <- function(x) {
  plot_merra(x, name = "PS_hPa", dirname = "images", fps = 5,
          limits = c(500, 1000), scale = 1, direction = 1,
          # palette = "YlGnBu",
          # legend.position = c(0.89, 0.05),
          legend.position = NULL,
          legend.name = ("hPa"),
           datetime.position = NA,
           expand.x = c(0.002, 0.005), expand.y = c(0.002, 0.005)
           )
}
# fig.PS_hPa(x)

fig.dPS <- function(x) {
  plot_merra(x, name = "dPS", dirname = "images", fps = 5,
          limits = c(-50, 50), scale = 1, direction = -1,
          # legend.position = c(0.9, 0.05),
          legend.position = NULL,
          legend.name = ("hPa"),
           datetime.position = NA,
           expand.x = c(0.002, 0.005), expand.y = c(0.002, 0.005)
           )
}
# fig.dPS(x)
library("cowplot")
fig.grid <- function(x) {
plot_grid(fig.W10M(x), fig.W50M(x),
fig.SWGDN(x), fig.ALBEDO(x),
fig.T10M(x), fig.PS_hPa(x),
# fig.dPS(x),
labels = c("W10M", "W50M", "SWGDN", "ALBEDO", "T10M", "PS"),
ncol = 2, nrow = 3, hjust = -0.1, vjust = 1.1, label_size = 10)
}
# ii <- lubridate::month(x$UTC) == 2; summary(ii)
fig.grid(x)
gif_merra(x, FUN = "fig.grid", dirname = "images", fps = 10,
gif.width = 576, gif.height = 360 * 1.5)
# gif_merra(x, FUN = "fig.grid", dirname = "images", fps = 10,
# gif.width = 576 * 2, gif.height = 360 * 3)
# gif_merra(x, FUN = "fig.grid", dirname = "images", fps = 10,
# gif.width = 576/1.5, gif.height = 360)
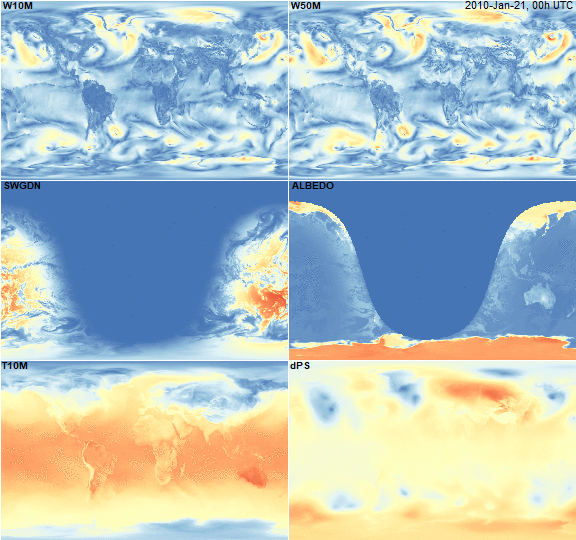
fig.grid2 <- function(x) {
plot_grid(fig.W10M(x), fig.W50M(x),
fig.SWGDN(x), fig.ALBEDO(x),
fig.T10M(x), fig.dPS(x),
# fig.dPS(x),
labels = c("W10M", "W50M", "SWGDN", "ALBEDO", "T10M", "dPS"),
ncol = 2, nrow = 3, hjust = -0.1, vjust = 1.1, label_size = 10)
}
gif_merra(x, FUN = "fig.grid2", dirname = "images", fps = 5,
gif.width = 576, gif.height = 360 * 1.5)